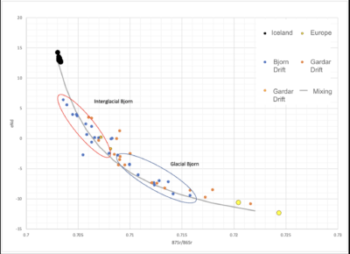
Actvity Summary: Students will use data from deep sea cores to interpret a graph. Students will apply their knowledge of isotopes to understand how scientists use chemistry to discover the origins of ocean sediments and infer changes in climate.
Jennifer C. Field
- Standard A: Unifying concepts and processes in science
- Standard C: Physical science
- Standard E: Earth and space science
- Patterns
- System and system models
- Stability and change
- Analyzing and interpreting data
- Constructing explanations and designing solutions
- ESS2.A Earth materials and systems
- ESS2. E Biogeology
- PS1.B Chemical reactions
