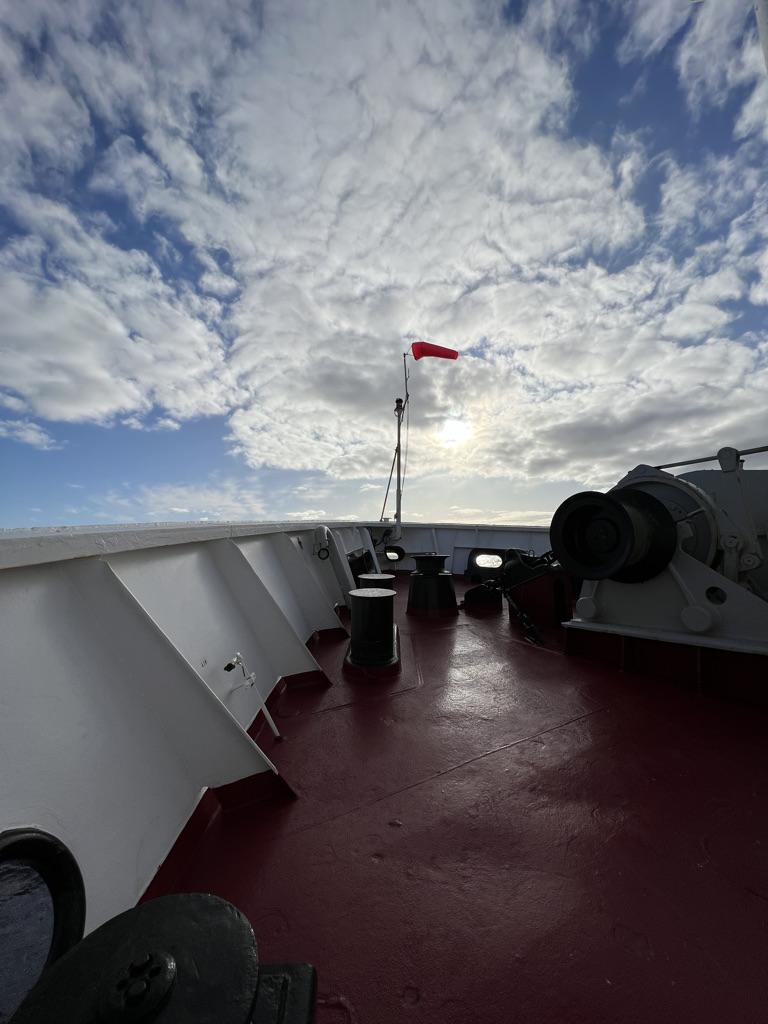
The never-ending 3 day journey
The JR set sail on June 11 with the excitement that we were finally doing it. After numerous travel delays, a 7 day quarantine in a hotel room, zoom meetings, and covid scares, we had finally started the expedition! The weather started out well but got increasingly more windy and bumpy. Seasickness tablets were distributed regularly and some of us really couldn’t shake the lethargy. It is now day 8 and though the weather is still kind of rough, some of us have been excitedly declaring they are feeling better from their seasick episodes. But here is the thing, it is day 8. The transit to the first site was expected to be 6 and half days so time is now really of the essence, once we get to the first site we have to hit the ground sprinting!
A daily operations report is a way for the operations team to record data regarding the performance and function of the ship per day. Below is a break down of the daily operations report for the past seven days for three measurements. Other details recorded on the report can be how much fuel we have left, and what maintenance tasks were completed.
|
Date |
Wind Avg Kts or m/s |
Swell Avg Ft/Mt |
Heave Avg Ft/Mt |
|
June 11 |
17 or 18.7 |
3/0.9 |
3/0.9 |
|
June 12 |
22 or 11.5 |
3/0.9 |
5/1.5 |
|
June 13 |
25 or 12.9 |
6/1.8 |
5/1.5 |
|
June 14 |
14 or 7.2 |
5/1.5 |
3/0.9 |
|
June 15 |
31 or 15.9 |
10/3.0 |
10/3.0 |
|
June 16 |
30 or 15.4 |
5/1.5 |
12/3.7 |
The table shows the measurements for wind speed in knots or meters/ second. Swell is the wave height and is shown with both measurements in Feet (Ft) and meters (Mt). Then I also included heave. Heave is the up and down motion the ship endures as it moves across waves, also measured in feet and meters. The motion that really gets seasickness going and the inability to walk up stairs as easily as you do on land.
Now let me put some photos of the waves per day.
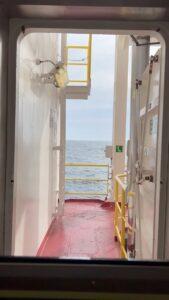
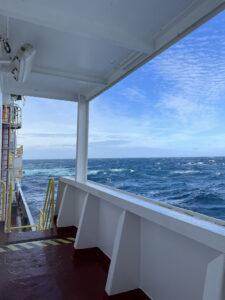
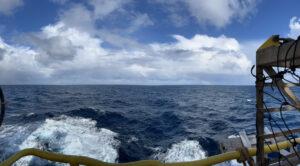
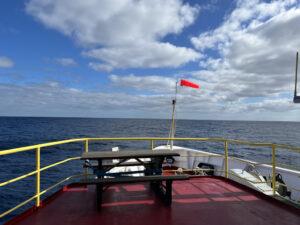
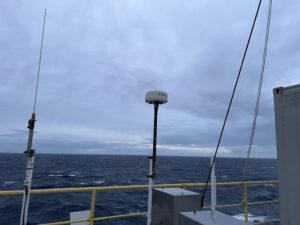
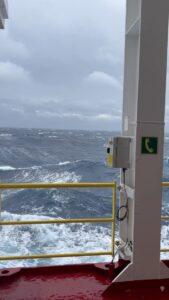
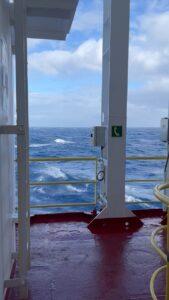
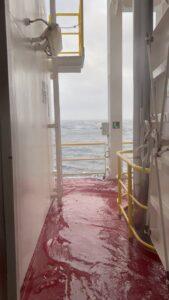
As you can tell June 14 and June 11 were the calmest days out of all of them. On June 14th, there wasn’t that much wind which made it easy to go out onto the bow to enjoy the sun by the picnic tables. The other days it blew so hard I barely could take a step. By June 15, we were strongly recommended to not go out on deck because the winds and waves were so strong that it would be unsafe. That was also the day I saw water slosh around the deck.
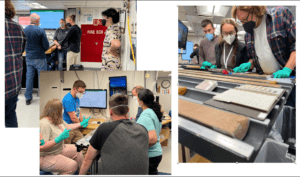
The team of scientists have not just been watching the daily operations report, they have also been doing some work in the labs. For instance, on June 13 a lot of cores from the previous expedition needed describing. They finally came up to the core labs ready for the scientists to poke, label, and smear. The lab came alive at that point, everyone finally could start doing what they have been waiting for.
Each day we kept seeing the ETT ( Estimate Time of Travel) as 3 days. On the worst weather day we were traveling at 2 nautical miles and the ETT was 10 days. That led to a lot of people grumbling. Luckily, the captain could confirm that it would not be 10 days, it would be 3. However, with the rough weather we got over the past week, it has been 3 days ETT for the past 3 days. It is no one’s fault that the weather has been so unruly, the positive side is that we have stayed safe throughout the transit, and that we just got salad bar privileges!
Our goal is to arrive at the first site on June 19th, which is now officially 2 days away, the weather is clearing up, and we are going faster!
Thanks for you interesting report and visuals. You almost make me feel as if I am sailing with you. Fortunately I am not experiencing seasickness but merely the excitement of your voyage!
Day 15 definitely looked challenging! Imagine you all are just waiting to get started!
Tess – I am sure you are receiving many emails! Great work young lady! Your passion and curiosity is amazing. So proud of you!!
I am trying to see if I can get some kids in the summer school program at Meriden to jump on one of your webinars!!
Uncle Jeff