Not all ice sheets are the same!
The Antarctic ice sheet is the main polar ice cap of the Earth and covers about 98% of the continent. About 61% of all the fresh water on Earth is held in this ice sheet which covers almost 14 million square kilometers.
However, the ice sheet which covers West Antarctica does not have the same behavior as the one which lies on East Antarctica.
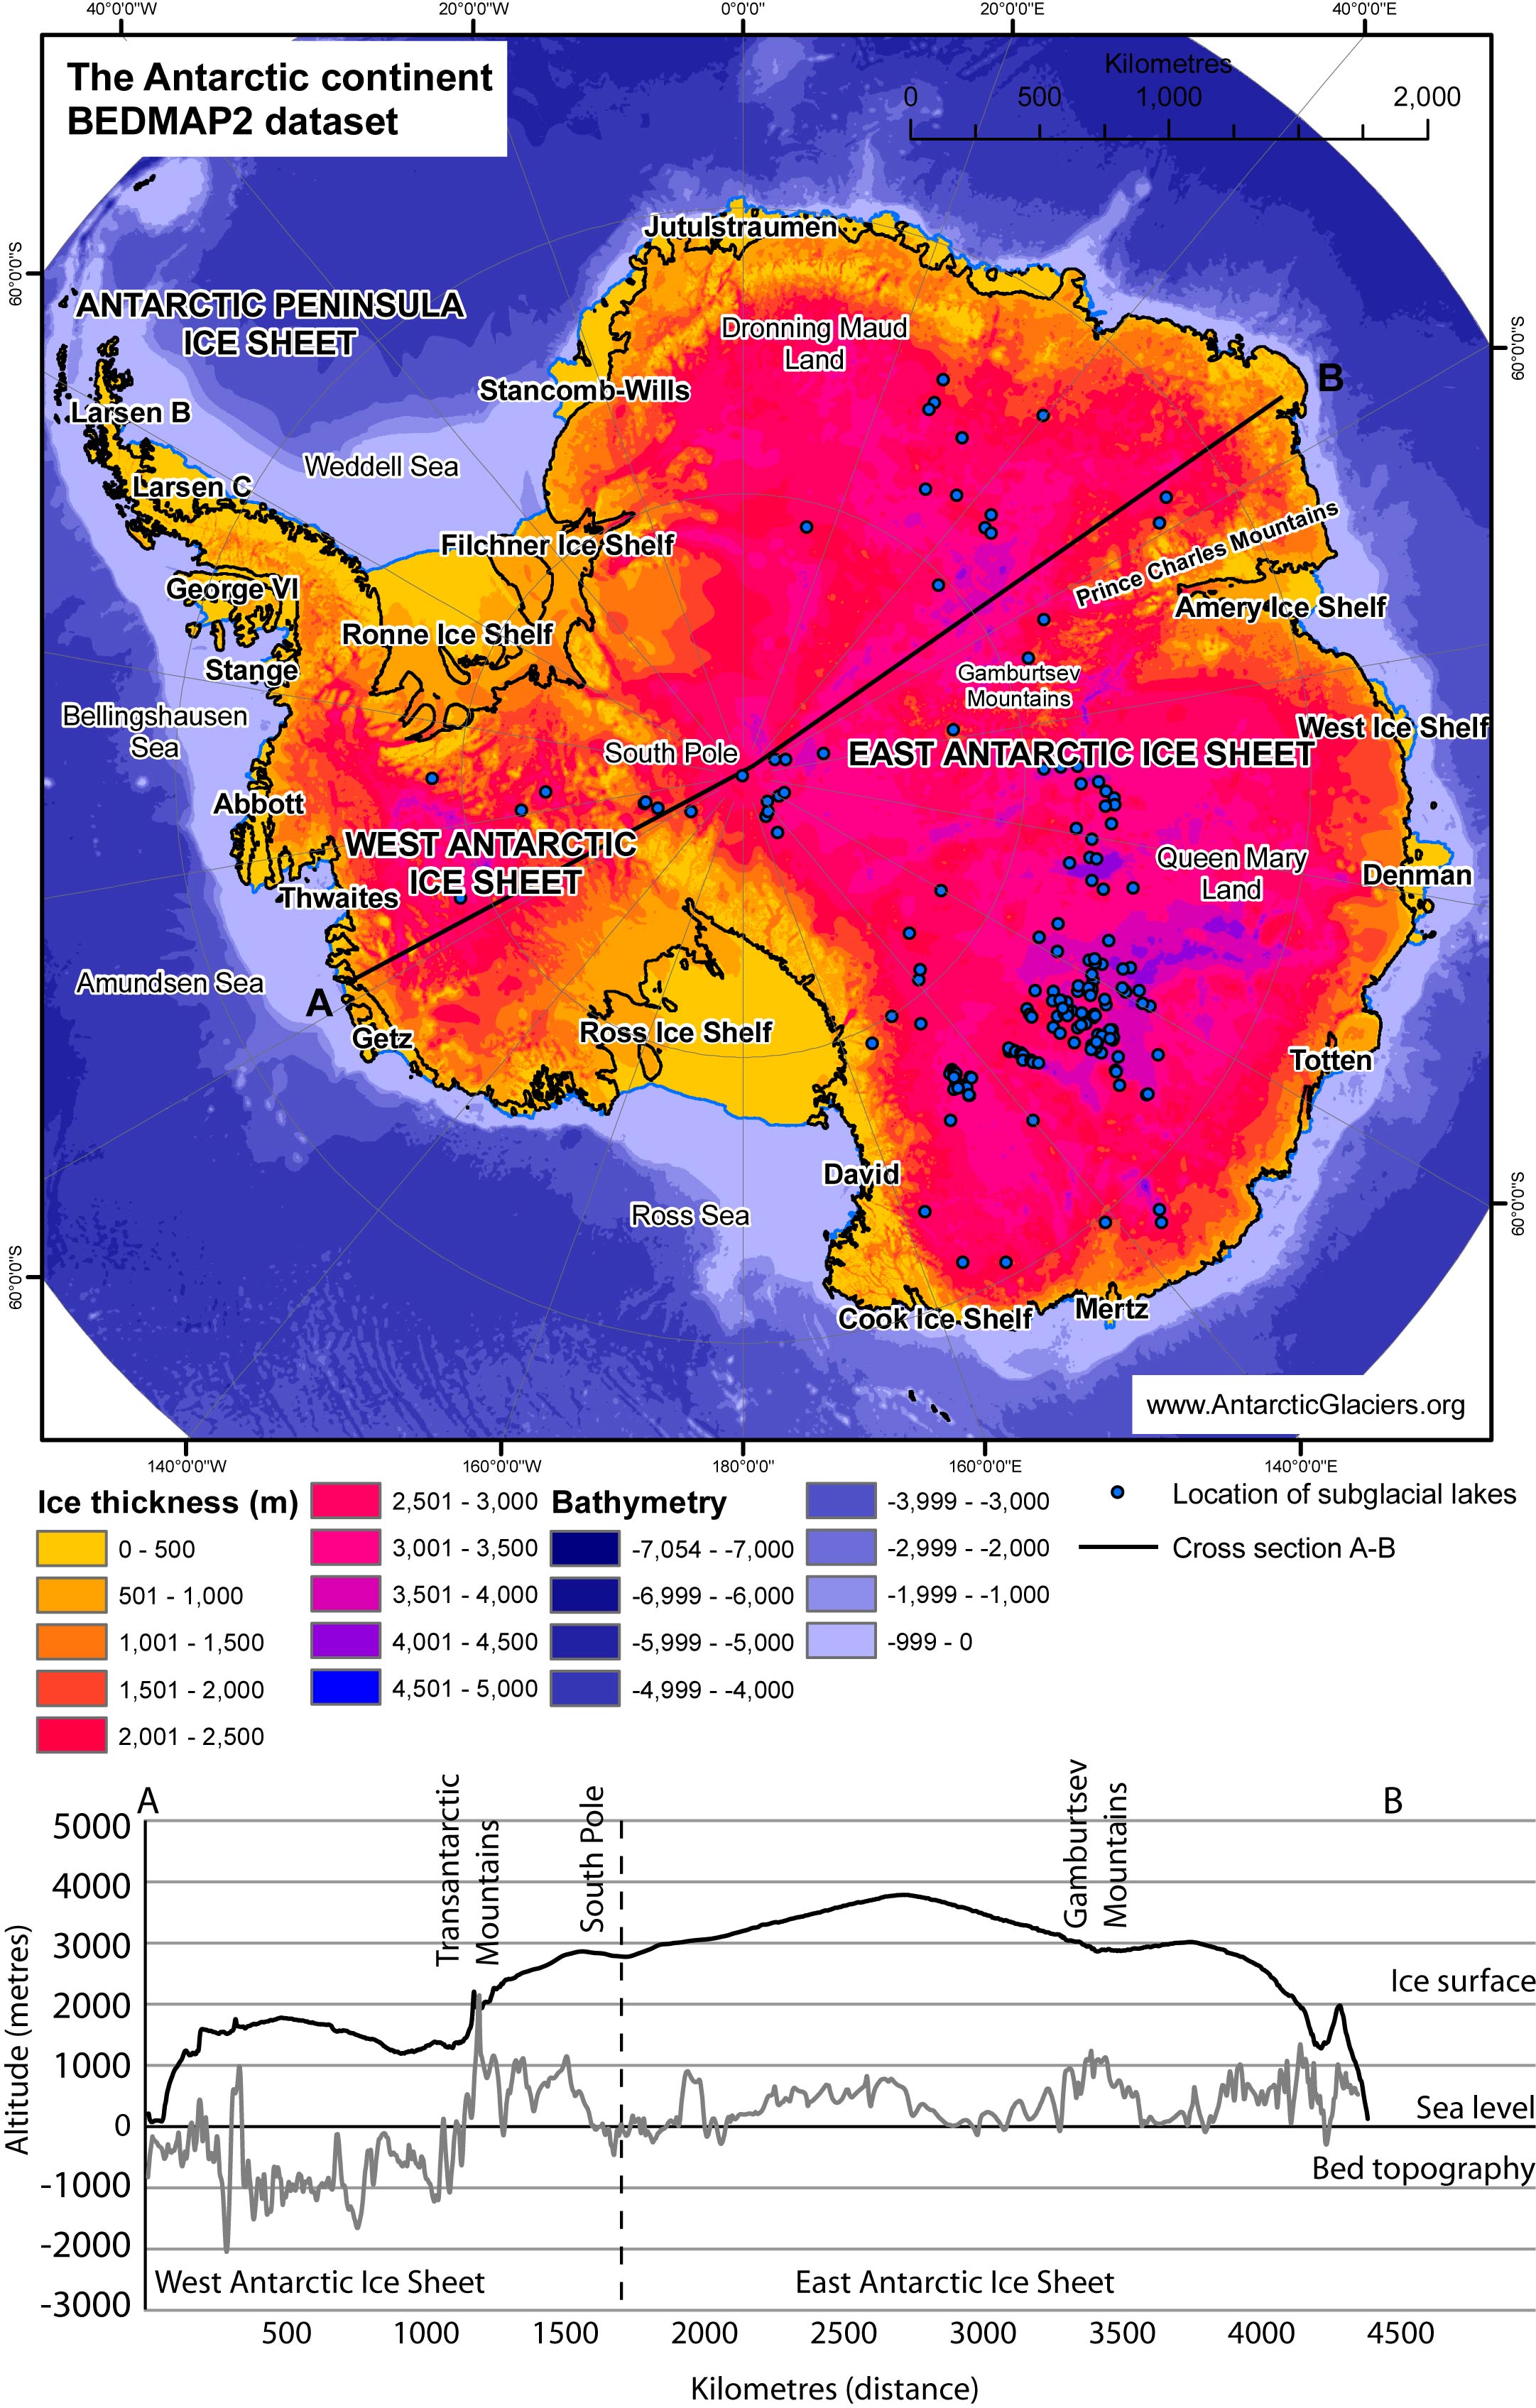
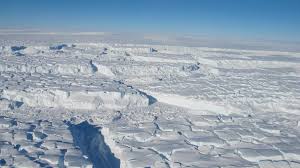
This picture shows that the average ice thickness is different across the continent, with a much thinner ice sheet on West Antarctica (around 2 km) than on East Antarctica (around 3 km). East and West Antarctica are separated by the high Transantarctic Mountains (around 2000m high).
There is another major difference between these two ice sheets: the East Antarctic Ice Sheet is grounded largely above sea level, whereas the West Antarctic Ice Sheet is mostly grounded well below sea level. The WAIS is called a “marine ice sheet” and is therefore very sensitive to sea level rise and changes in ocean heat (and because water is more efficient than air at melting ice).
There is evidence that the WAIS has known events of collapse in the past when temperatures were higher than present (Pliocene and Miocene). ANDRILL core records show brief intervals of collapse during the Pliocene. But the records of the Miocene were less clear and thanks to Expedition 374, we will probably get more information of how the WAIS has behaved during the Miocene.
A total melting of the WAIS could trigger a rise in sea level of about 5 m compared to the actual sea level. But the isostatic rebound after the melting of the ice sheet could make up in part for that rise of sea level. Another crucial parameter to consider is the thermal expansion of ocean during warm periods, which tends to increase sea levels…
Past variations of the extension of the WAIS have to be linked to former sea levels to better understand what will happen in the future.
We nowadays have proof that some of the glaciers of the WAIS are thinning (the Pine Island Glacier for example). You can visualize the actual ice flow in the Antarctic ice sheet on this numerical model:
The white dots show how particles move with the ice, which are initially randomly distributed over the ice surface. The colors show the flow speed.
Global sea levels are currently rising at an average rate of 1.8 mm per year since 1961, and 3.1 mm per year since 1993. The main contributions for this rise are from melting glaciers and ice caps and thermal expansion of the ocean.
There are so many parameters to consider, and many ice sheet processes that are poorly understood, that it is difficult to predict how much the sea level will rise in the future. But the amount of ice that terminates in the ocean is definitely a key factor in the potential risk of future rapid retreat of the Antarctic ice sheet.