Science-ing the Storm
This post was written by Ed Robeck, Director of Education and Outreach at the American Geosciences Institute (AGI) and School of Rock October 2023 instructor.
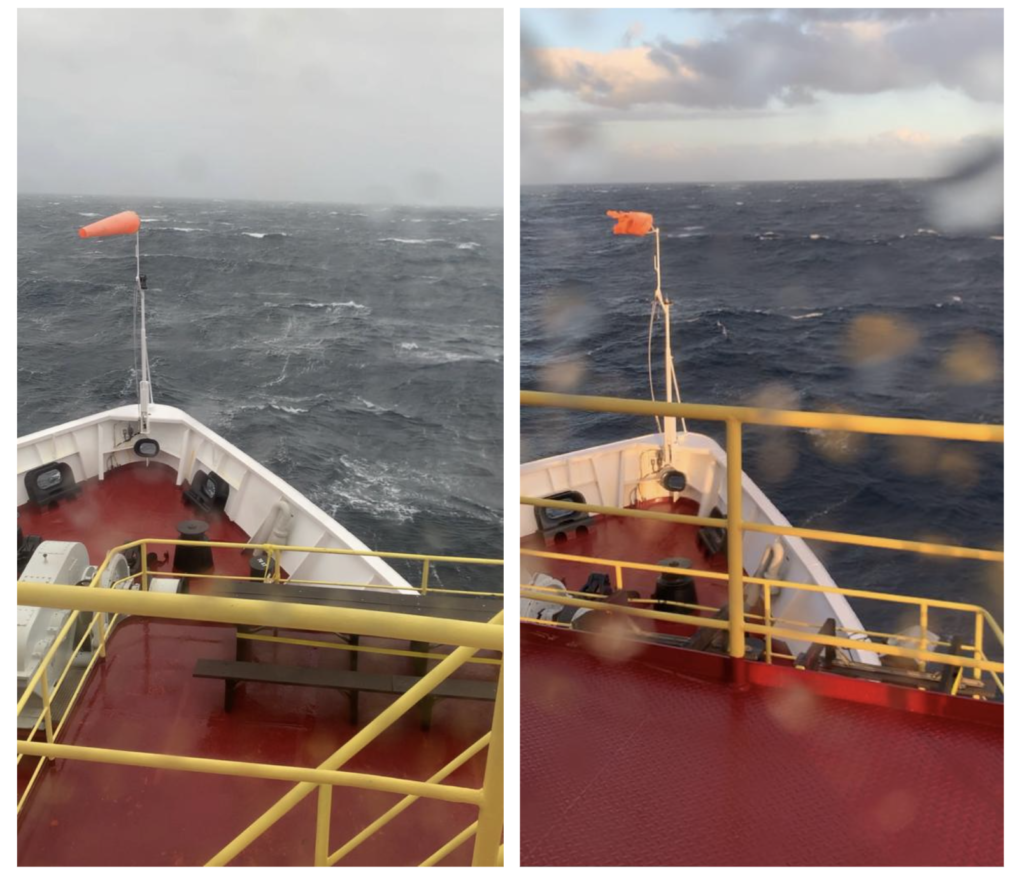
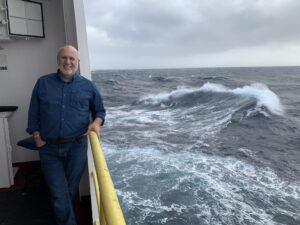
On the transit from Reykjavik to Amsterdam during IODP expedition 400T, the seas are giving our group of science educators a lot to think about. Waves of 4-6 meters are moving the JOIDES Resolution in all directions (rolling, pitching, and heaving), and we are all feeling the effects of the storm as it does. In fact, those movements have forced us to slow our headway considerably from what would be normal speed, postponing our arrival by a day. So, of course, a bunch of us started science-ing about the situation.
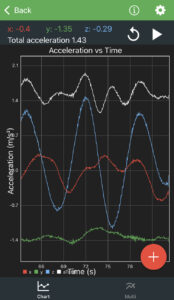
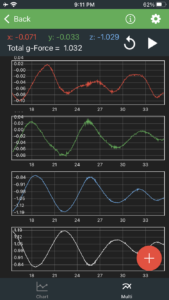
Fortunately, one of the teachers, DaNel Hogan, has an app (Physics Toolbox Suite) on her phone, which provides the data we need to do some impromptu explorations. The app records acceleration in all three dimensions. Since the dramatic up and down motion was most unusual for us, we paid attention to the z-dimension acceleration first, which turned out to be about ±1 m/sec^2 most of the time, (in round figures—with extremes more like ± 2 m/sec^2 ). Knowing that the acceleration of gravity is 9.8 m/sec^2 , that measurement suggests that a person would experience an effective change in weight (but not mass, unfortunately) of ±10%. That is, a +10% acceleration on the ship’s upward movement, and -10% on the downward movement—or a total of 20% across the period of a single cycle. The period of the oscillations on the ship range from about 6 seconds to about 12 seconds—averaging 9 seconds, which happens to be almost exactly the time it takes to carefully ascend or descend a staircase on the ship. This means that a 150 lb. person would feel themselves change from about 135 lb to 165 lb while moving between decks—a 30 lb. difference in the weight the person would feel. That’s effectively the change from feeling like “I can fly” to something like “I just can’t take another step!” That was a change we could all identify with moving around the ship.
We were talking about this while sitting in the conference room where we spend most of our time, and we noticed empty chairs swinging around in unison. Sometimes they’d rotate about 20º before turning back, and sometimes rotating almost 180º. Is this inertia, suggesting that the ship is pivoting that much beneath them? Probably not. On the wall of the conference room there is a monitor that shows various data about our trip, including the heading (where we’re going) and the bearing (which way the ship is pointing). The two are diverging to varying amounts due to the strong wind off the port bow, (probably with a lot of noise in the signal). The variation we see of 10º – 20º would not support inertia as the main cause of the free-swinging chairs. After some discussion, we came to the shared interpretation that the chair movements have more to do with the chair’s center of gravity being offset from its axis of rotation. With each pitch of the ship, the center of gravity is raised, leading to added torque being generated, which leads to the chair swinging around until the center of gravity is on the low side. When the next movement in the opposite direction takes place, the chair swings the other way.
These are not entirely empty machinations. Some of it becomes important in the core labs. For example, we considered the fact that mass of core segments is important in many calculations of their properties. How does one calculate the mass of a sample when the scale is being accelerated up and down randomly? The solution is conceptually elegant. There are two scales—one with a sample and the other with known mass. The acceleration can be easily calculated based on apparently change in the force on the scale produced by the known mass, which provides a correction for a computer connected to both scales. That correction is applied to the sample reading to calculate its mass in real time.

There are other effects we are observing—sliding of smooth objects, rolling of anything laid on a round side (crayons on tables were especially fun)—all of which we’re getting used to and many of which are more straightforward to explain using a combination of friction, inertia, and gravity. Other effects are now feeling normal, too—loud bangs and vibrations from waves hitting the ship, sloshing of water on the deck, and creaking bookshelves. All in all, the waves have made for a voyage that is even more interesting than anticipated—and for those of us less affected by nausea—an opportunity to apply science to yet another experience provided by life on the JOIDES Resolution.