
Seeing in Snapshots
How do we learn about what we cannot see? While so much is known about the surface of other planets and moons, we know very little about the part of the Earth that is under the ocean.
This is partly because it is not easily visible. NOAA’s current estimate put the mapped portion of the ocean floor at only 23.4% and only 5% of that has been mapped with modern techniques. Older mapping techniques only have a resolution of about 1 mile, so if a feature is smaller than 1 mile in size, it may not have even made it on the map. In the past, it has been very difficult to know what was under all that water. Today, multibeam sonar, which has a resolution of about 330 feet, can be used to show the seafloor in surprising detail. But what about the secrets UNDER the seafloor? Scientific ocean drilling is one way we can unlock the mysteries of what is hidden beneath.
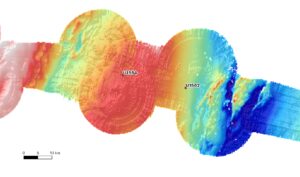
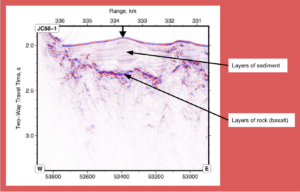
When scientists look for clues to the past, they usually look on or under the surface of the Earth. On land, this may mean digging pits for fossils, looking at road cuts or canyons for a peek at layers of sediment or examining rock formations. All of this information can be used to determine the history of an area and how the environment there has changed through time. But what about the history of the ocean basins? The ocean plays a huge role in the climate systems on Earth. Covering 70% of the planet, it has a major influence on atmospheric conditions. To better understand the current changing climate, we need to look for clues about how past climate changes have affected the ocean and the atmosphere. The best way to do this is by pulling up cores of rock and sediment and analyzing them. The deeper we core, the further back in time we can go. The seafloor where the JR scientists are sampling has already been mapped using seismic data, which creates a profile of the sediment and the rock under the water as well as sonar which provides a 3-D image of the sea floor.
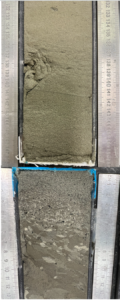
But images provide only limited data, such as what landforms are on the surface and the relative density of material under the surface. Where the rock or sediment came from and how and when it got there (the provenance) is still mostly a mystery. Only when the cores come up can we get a snapshot of what is down there; and snapshots they are. These samples are really tiny when you think about the vastness of the ocean, it is like using a standard sized straw to test the soil in your garden, but your garden is the size of the U.S, Canada, Mexico and Brazil combined. So many questions would remain unanswered. Would you know if there were rocks or roots? Is there enough organic matter? Are there worms? What was grown there last year? That is where we are with scientific ocean drilling.
Because a core is relatively tiny, it is important to take several of them in one area. Replication in science is key. The more data there is, the more we are sure that the data is correct. The data that we can get from cores can indicate how old the sediments are, what the climate was like when they were deposited, and what types of organisms were there. If we can compare all of the results from the same area, we would know that if, for example, we found few foraminifera in a number of layers that it was not just a bad sample if all of the samples had the same thing happen at around the same time. The more cores we have from an area, the higher our confidence is in the data.
Replicates of cores also allow scientist to correlate age models based on multiple factors. Fossil records, magnetism, ash layers, and isotope ratios can all indicate the age of the sediment. By using all of the age-related data retrieved from the samples, we can be confident in the age of the sediment. This means that any information about past environment can be linked to other significant events on the Earth that happened during a similar age.
References:
1.“How Much of the Seafloor is Left to Explore?” oceanexplorer.noaa.gov. National Oceanic and Atmospheric Administration. 29 June 2023.
2.“How Much of the Ocean Have We Explored?” oceanservice.noaa.gov. National Oceanic and Atmospheric Administration. 20 January 2023. 29 June 2023.