The stages of Te Matakite’s installation
Our first observatory on Expedition 375 is one of the most complex ever installed because instrument packages have to fit in the narrow casing, inside each other. This happened in stages over the course of about eight days. Thankfully the sea was calm and we were successful!
Stage 1: Te Matakite is measuring fluid pressure at different depths in the borehole
To measure how fluid moves and changes during slow slip earthquakes we designed pressure sensors to go down first. We lowered casing (the pink pipe in the image below) into the seafloor, guided by a re-entry cone (grey funnel) already deployed. The casing has 3 tubes (shown by the turquoise lines in this image) strapped to it that are connected to pressure sensors (orange zones) at three different depths: above, within, and below the fault zone.
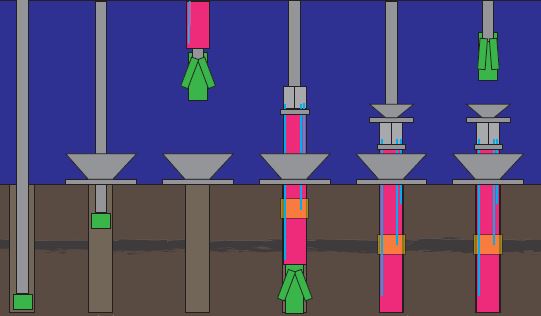
To see crew strapping on the pressure sensors in the ‘umbilical’ tubing, watch this video
Once the tubing is in place, the valves are closed at the top and the whole assembly is lowered to the seafloor. Seen here in this video:
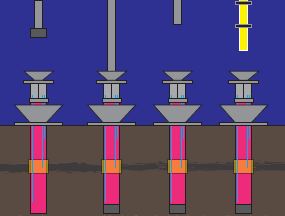
Stage 2: Te Matakite also measures temperature and chemistry changes in the fault zone
To monitor temperature and chemistry changes in the borehole, the borehole must be isolated. This information will greatly add to our understanding of what happens in the fault zone during slow slip earthquakes.
We did this by closing the top of the hole with a “wellhead” and the bottom of the hole with a “bridge plug”. In addition, we further isolated the fault zone with packers (black horizontal bars). These are long elements made of rubber material that will expand once it is submerged in water and will seal off the fault interval inside the casing from the intervals above and below it. Once this was done, we lowered in even narrower casing (yellow pipe) and a second smaller wellhead.
This smaller wellhead is needed to suspend the instrument string (shown by the orange rope in the diagram below) that is composed of several miniature temperature sensors (purple dots) spaced out at different depths, an OsmoSampler (green capsule; to capture fluids for chemical analyses) and Flow meter (red box; to measure fluid flow).
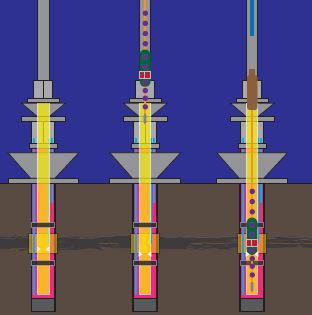
The rope is attached to a plug that will seal the top of the smaller inner casing, so it can remain there undisturbed to record slow slip events over time.
Success!
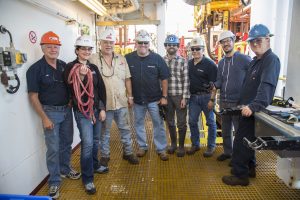
The observatory team has planned this observatory for years – they are thrilled it all went well and is now in place to measure slow slip events in the Hikurangi Subduction Zone. It sounds like it was easy described and drawn like this, but remember that we are in 2640 m of water, with the steel pipe being moved about like spaghetti in the water under the ship! So, it’s an amazing engineering feat and very challenging to install one.
Collecting the data
In a few years, we will return to Site U1518 with another vessel to retrieve the data using a robotic submarine, or ROV (Remotely Operated Vehicle). This will connect to the wellhead with a cable and download the pressure data and send it back up to a computer on the ship. The next step is harder. To access the temperature and chemistry data and samples, we have to pull up the temperature logger and OsmoSampler string using the ship’s winch. If portions of the string are stuck and cannot come up, there are three “weak” links in the string designed to break at different forces so that a portion of the string can stay behind and the rest of it can be retrieved.