Act Your Age (or, What’s in a Number?)
This entry is written by Debbie Thomas, co-chief scientist of Expedition 378. It comes from her Expedition 378 Odyssey blog, which can be found here.
How do we determine the age of the sediment layers that we recover in deep-sea drill cores? And another: Why do we need to know the age of the layers of sediment in the cores we recover?
I’ll answer in reverse order – in the sequence of sediments that we are recovering at Site U1553, we know that the age of the sediments gets older as we drill deeper down through the layers because tectonic processes have not disrupted the vertical nature of the sediments. So as we drill, we know that we will encounter progressively older sediments, and thus we are confident that the events we recover deeper in a hole happened before the events that are recovered at shallower burial depths. But, how do we know if what we recover at Site U1553 is the same as an event known from another location in the ocean basins? How do we know how rapidly (or slowly) the sediments accumulated? In order to determine dates and rates, we must be able to assign numeric ages to the depths of our sediment cores. And this is far more challenging than you might imagine!
To determine the initial age of the sediment layers on board the JR, we staff the science party with experts in the disciplines of Micropaleontology and Paleomagnetism. In this first post on dating (geologic ages, not dinner and movies…), which may be the 5th post in the So Now What? series, I will focus on micropaleontology and the resulting biostratigraphy that it provides us to help constrain geologic ages. Stay tuned for a future installment on Paleomagic, er, I mean Paleomagnetism.
Micropaleontologists study the composition of the very small (you know, micro…) fossils that occur in the sediment samples. The evolutionary record of plankton (both zooplankton and phytoplankton) has left us a rich record of the geologic timing of first appearances (origination) and last occurrences (extinction) of species of many different taxonomic groups. Don’t worry, I will provide cool photos to illustrate!
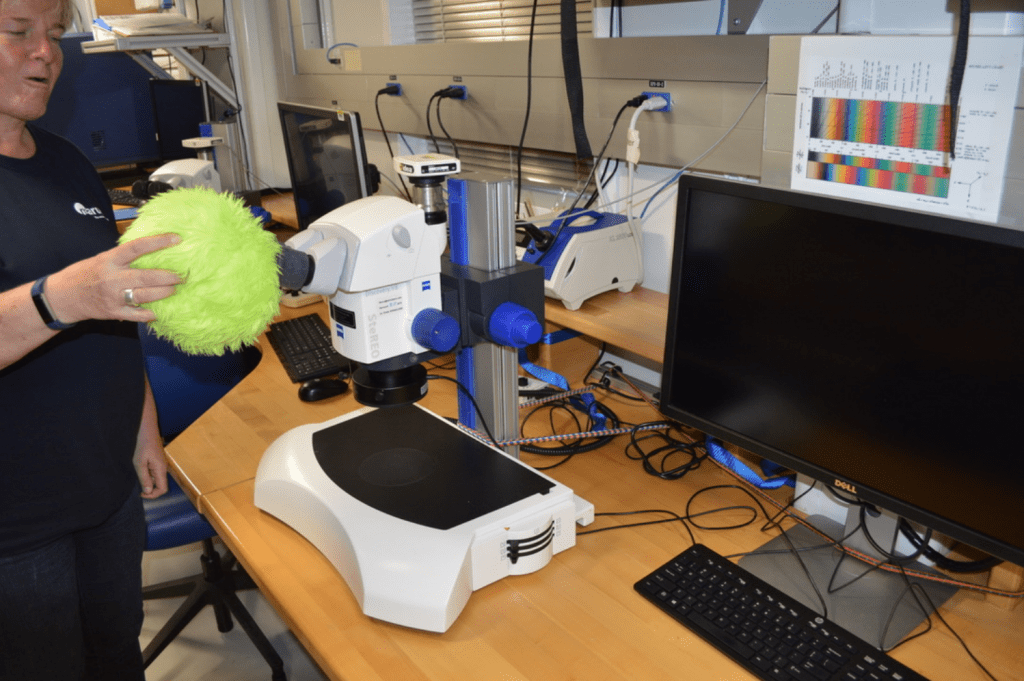
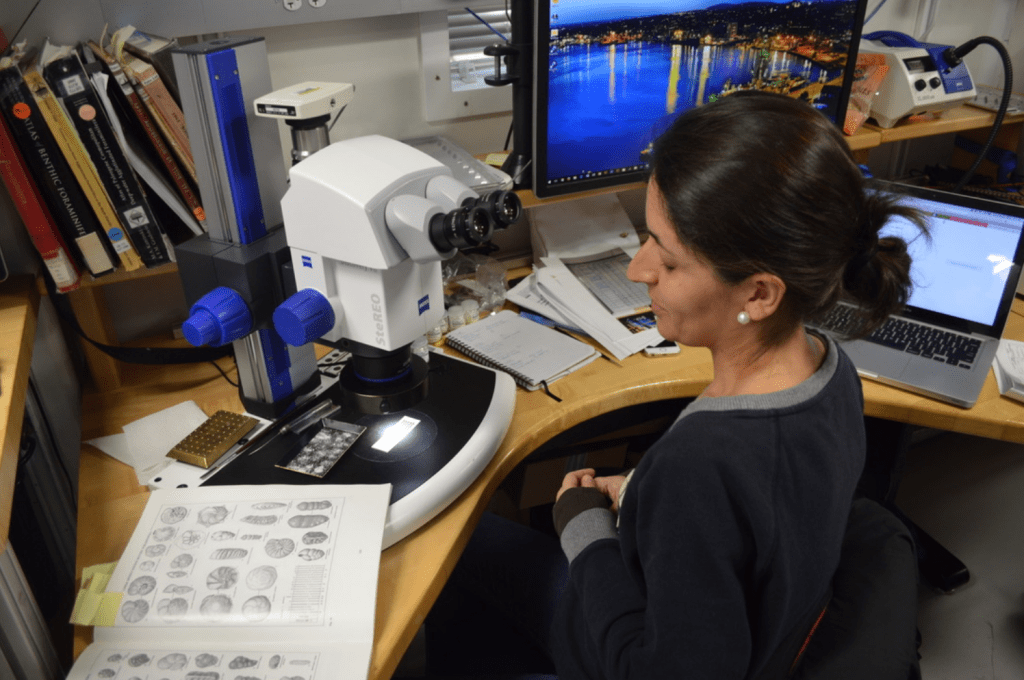
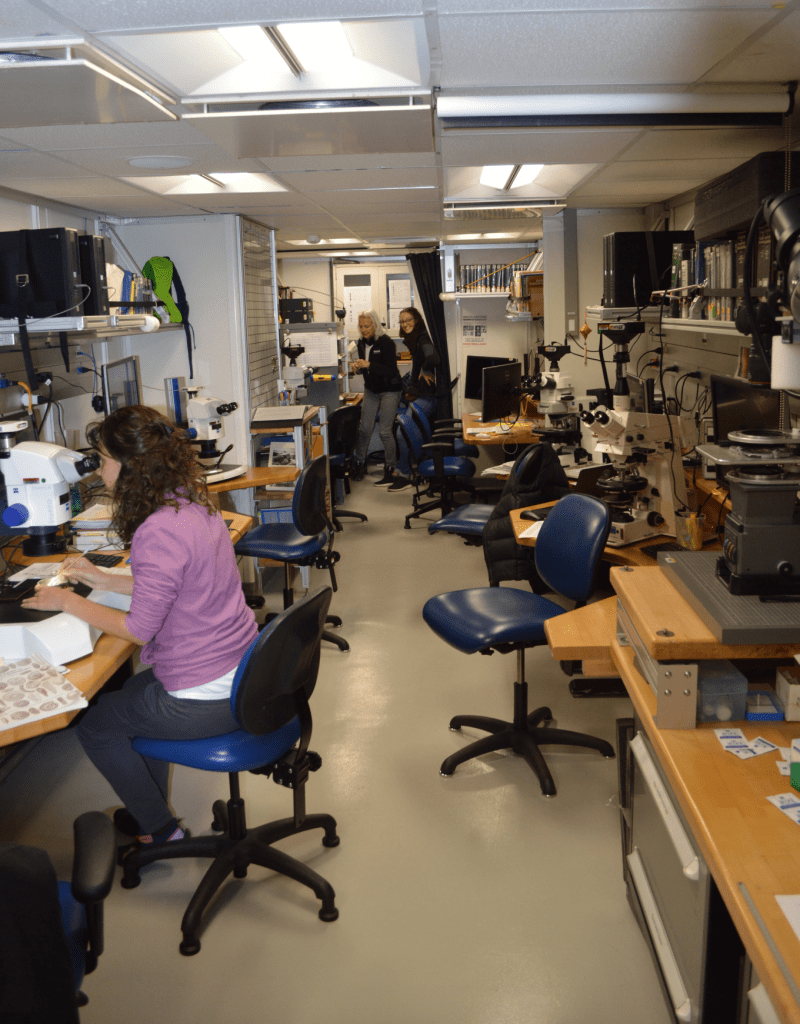
Let’s start with the phytoplankton since they tend to command the spotlight – Calcareous nannofossils. Isabella and Rosie (with guest appearances from our Phys Propper, Heather) examine the calcaerous nannofossils, or nannos as we refer to them. As you might have guessed from their name, these single-celled photosynthetic organisms leave behind fossils that are made of calcium carbonate (CaCO3). Team Nanno examines the assemblage of the species in each sample by using a toothpick to smear a small amount of sediment on a microscope slide (the highly technical term for this is a toothpick sample):
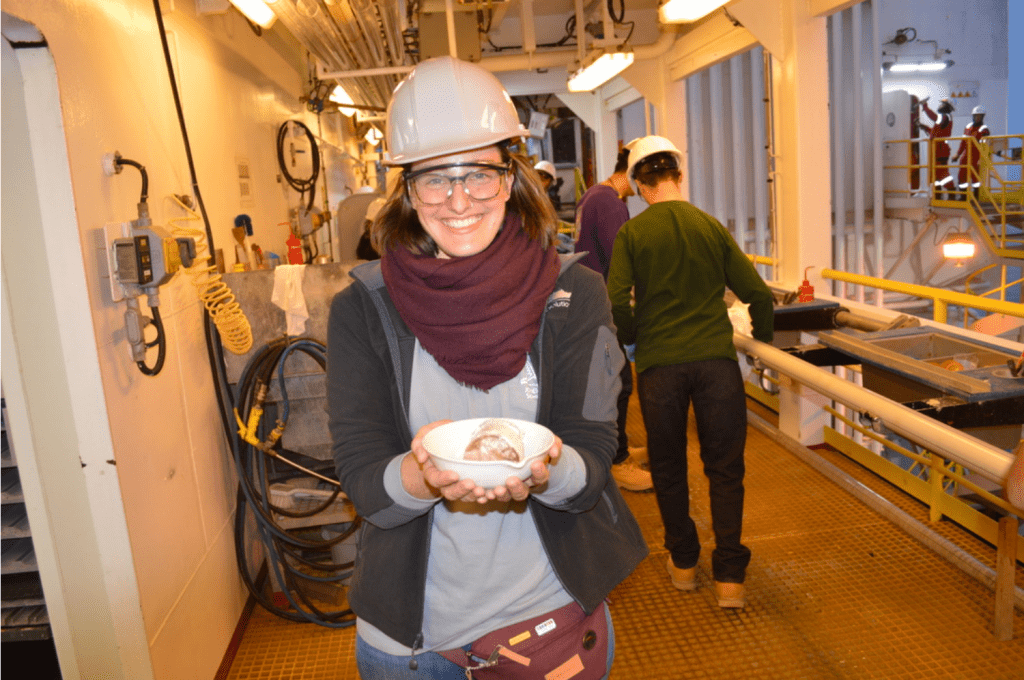
Rosie’s fingers always figure prominently in the posts, so here she is in her entirety collecting the cereal bowl of core catcher sample on the catwalk:
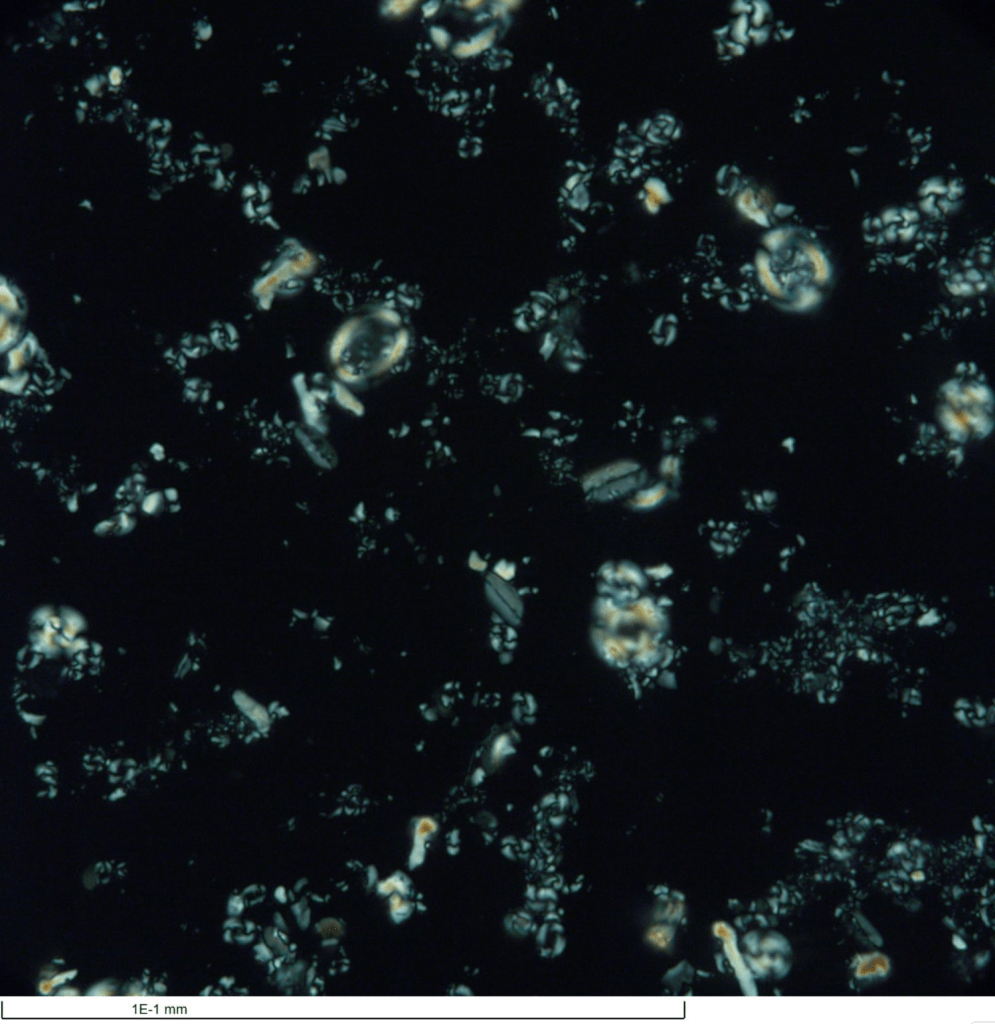
They then use both plain and polarized light to identify the nanno species in the slides (the image below is polarized light to catch the cool optical properties of CaCO3):
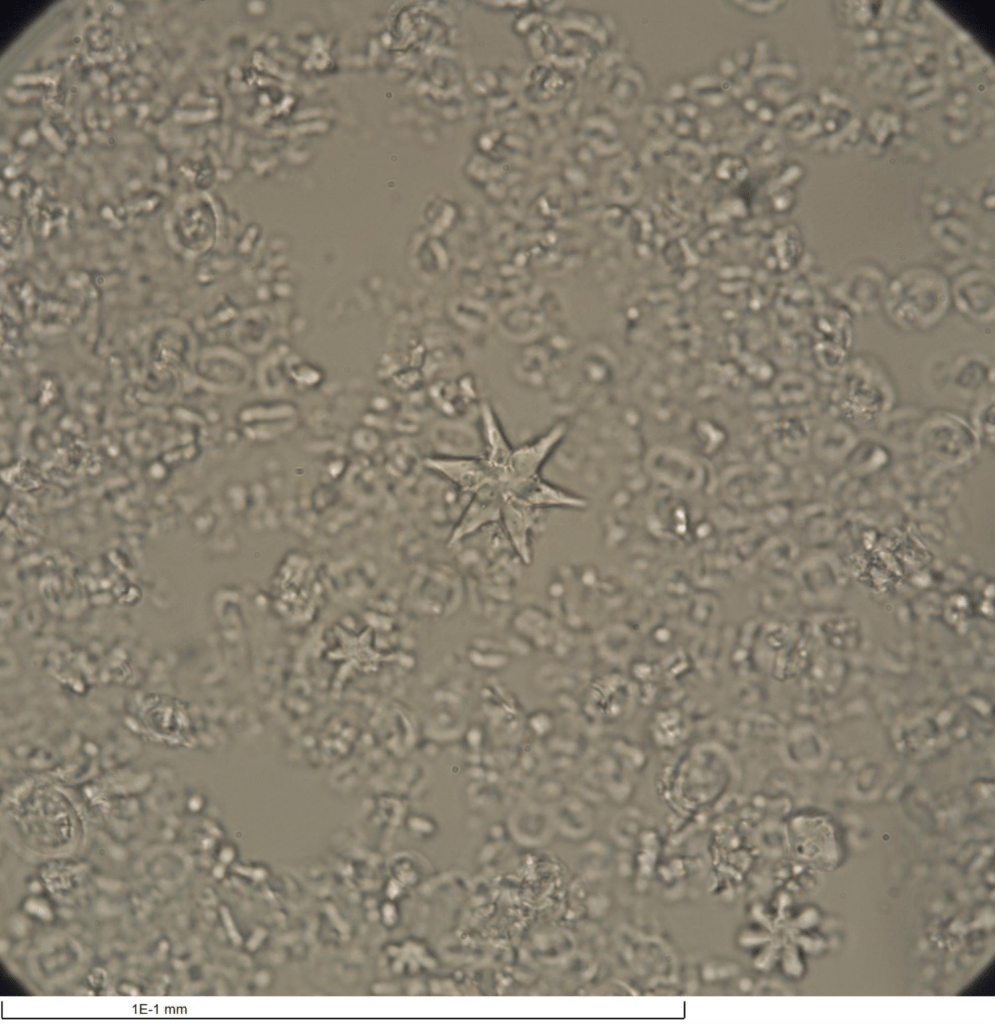
And this image is in plain light in which the CaCO3 appears clear (note that this image is not of the same sample as above):
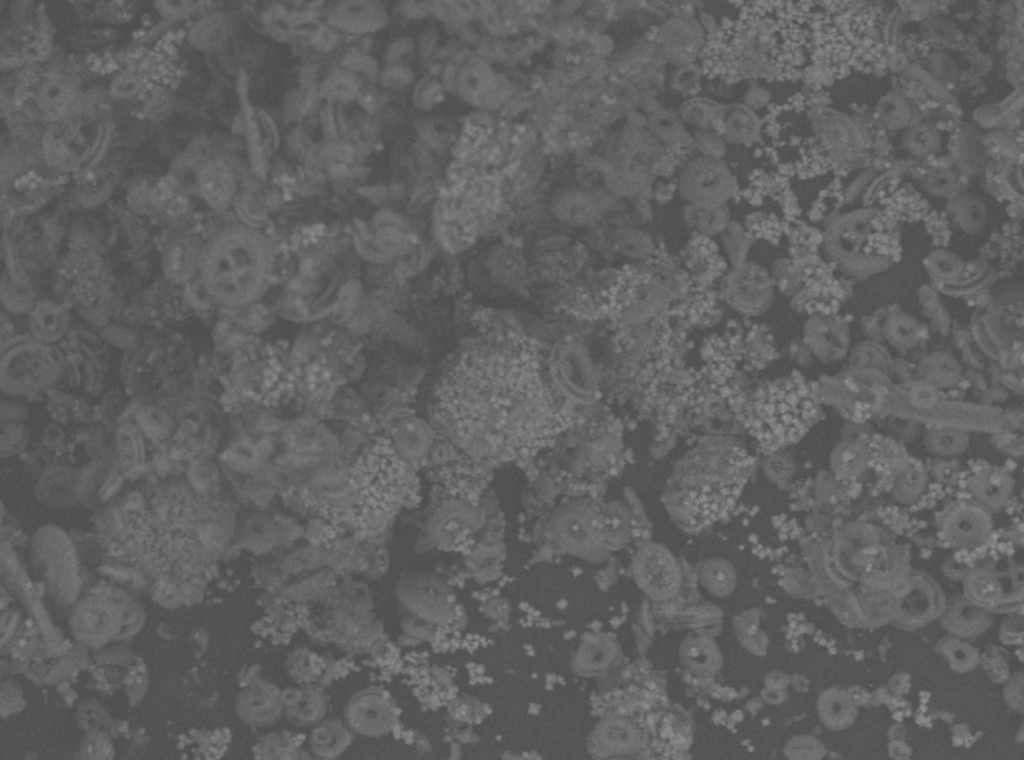
Shipboard scanning electron microscope (SEM) images of these amazing little fossils reveal even cooler details about their structure:
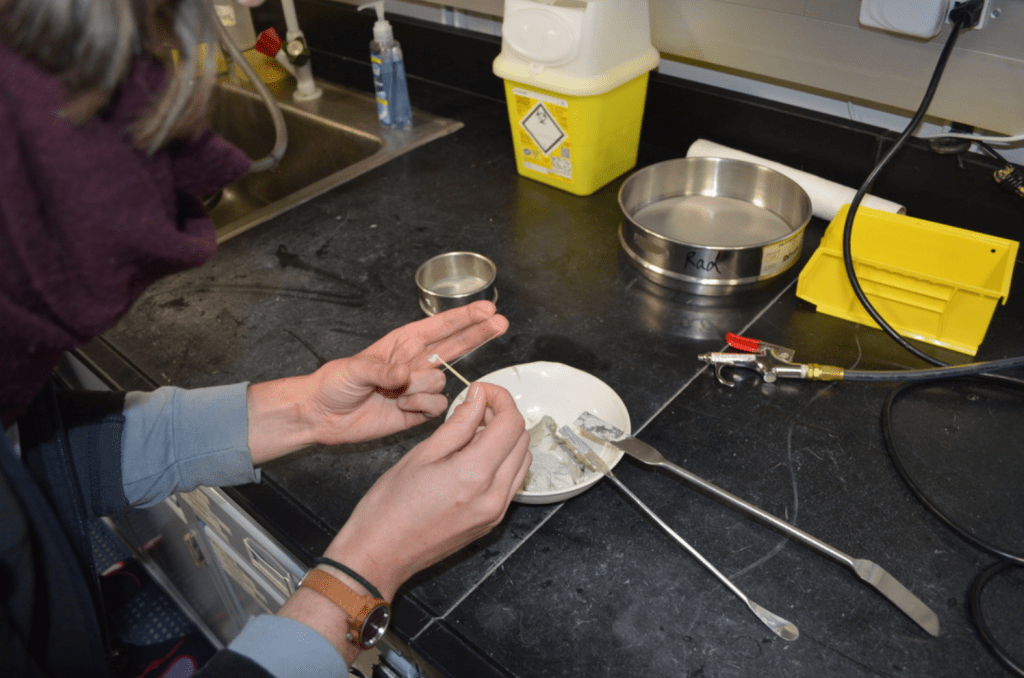
Another very important group of microfossils is the foraminera. Forams are single-celled zooplankton that produce CaCO3 shells, and these critters dwell at the sea-surface (planktonic forams) or on the seafloor (benthic forams). One of the most important analyses we perform back home in our laboratories involves dissolving the forams and analyzing the carbon and oxygen isotopes of the CaCO3. However, we try not to talk about dissolving the beautiful shells in front of the micropaleontologists…they need to study the intact fossil species in order to help determine the geologic age and depositional environment of our samples.
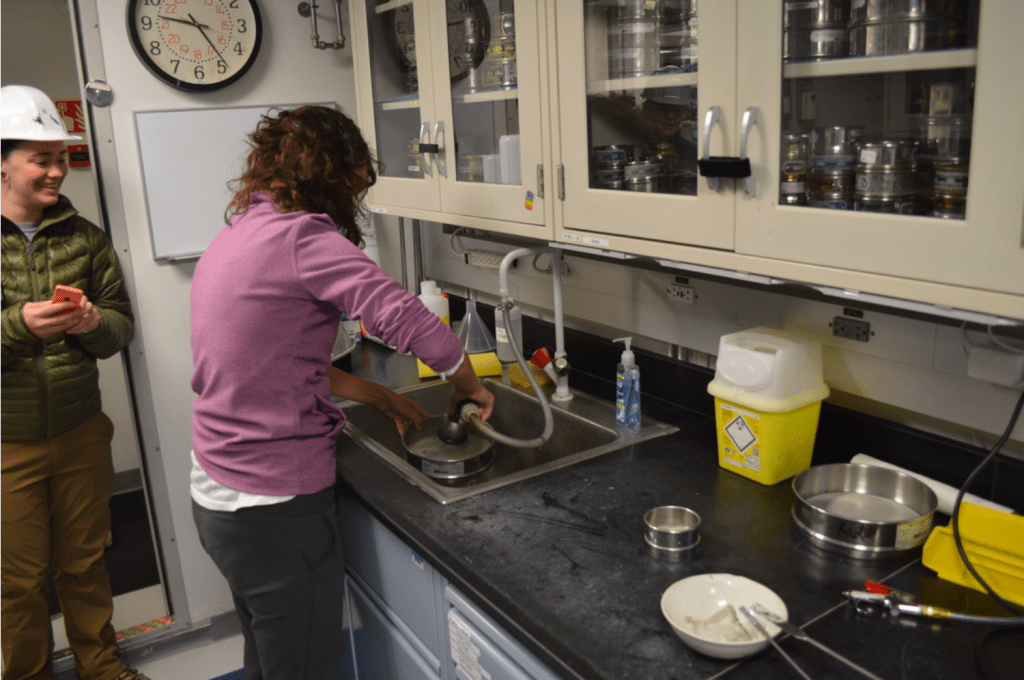
Preparing the foram samples requires a bit more time and effort than merely swiping a toothpick on a slide. The samples are washed and sieved in order to isolate the shells:
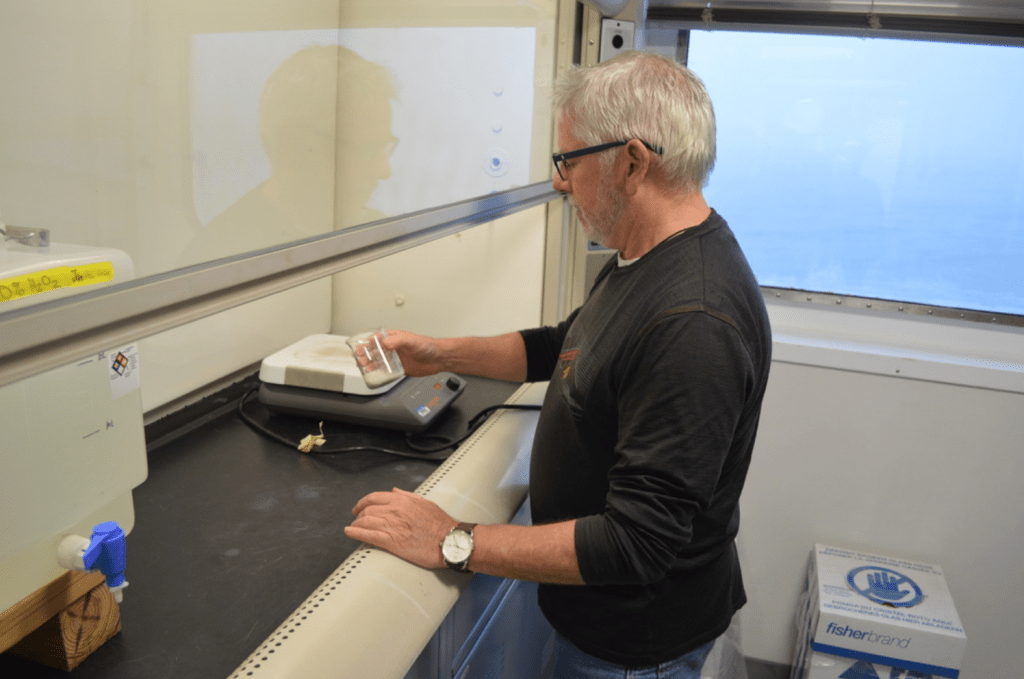
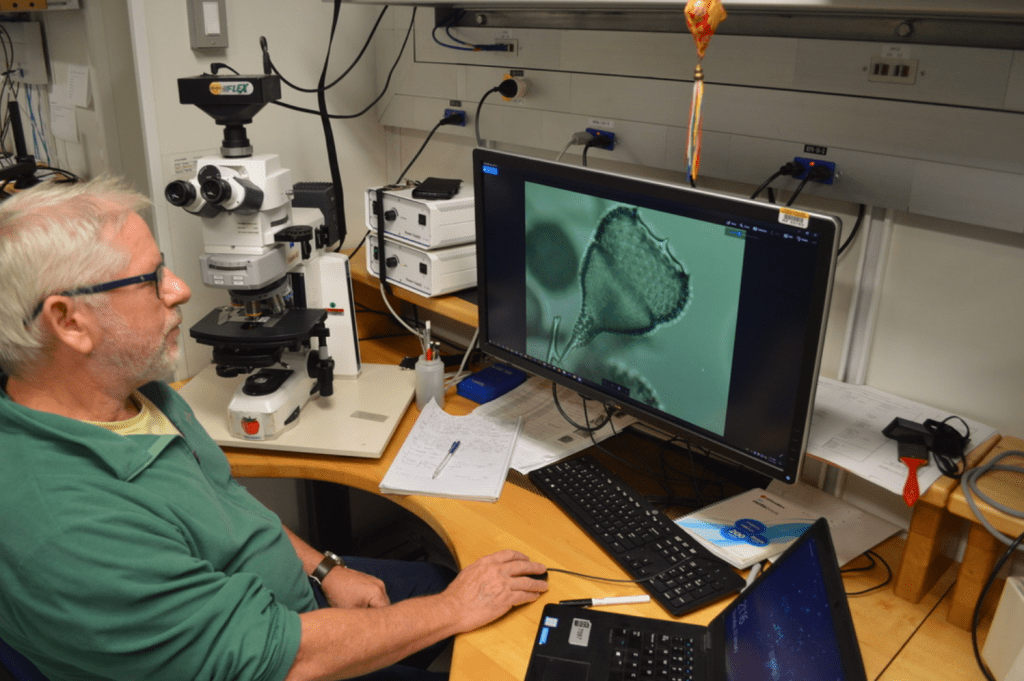
Our next group of zooplankton is the Radiolaria. Rads are closely related to the planktonic foraminifera, with one key difference. The rads produce a skeleton made of silica (SiO2) and are glassy and clear instead of white. Below, Chris is isolating the rads from a core catcher sample and then we will see him at the microscope working on species identification:
Let me interject with a reminder that ALL THESE AMAZING LABS AND ALL THIS AMAZING ANALYTICAL EQUIPMENT IS ON A SHIP…. AND WE ARE IN THE MIDDLE OF THE OCEAN…WITH INTERNET TO SHARE THIS ALL WITH YOU…ARE YOU BLOWN AWAY?!?! I CAN ASSURE YOU THAT WE ARE, CONSTANTLY…
Ok, I’ve calmed down.
Once the micropaleontologists have assessed the assemblage of species in the samples, they work to assess their data using the established biostratigraphic framework in which the appearances and disappearances of the key species have been assigned numerical ages. This framework is the product of decades of studies at hundreds of locations, and continuously is being refined as we acquire new data and better radiometric ages of ash layers.
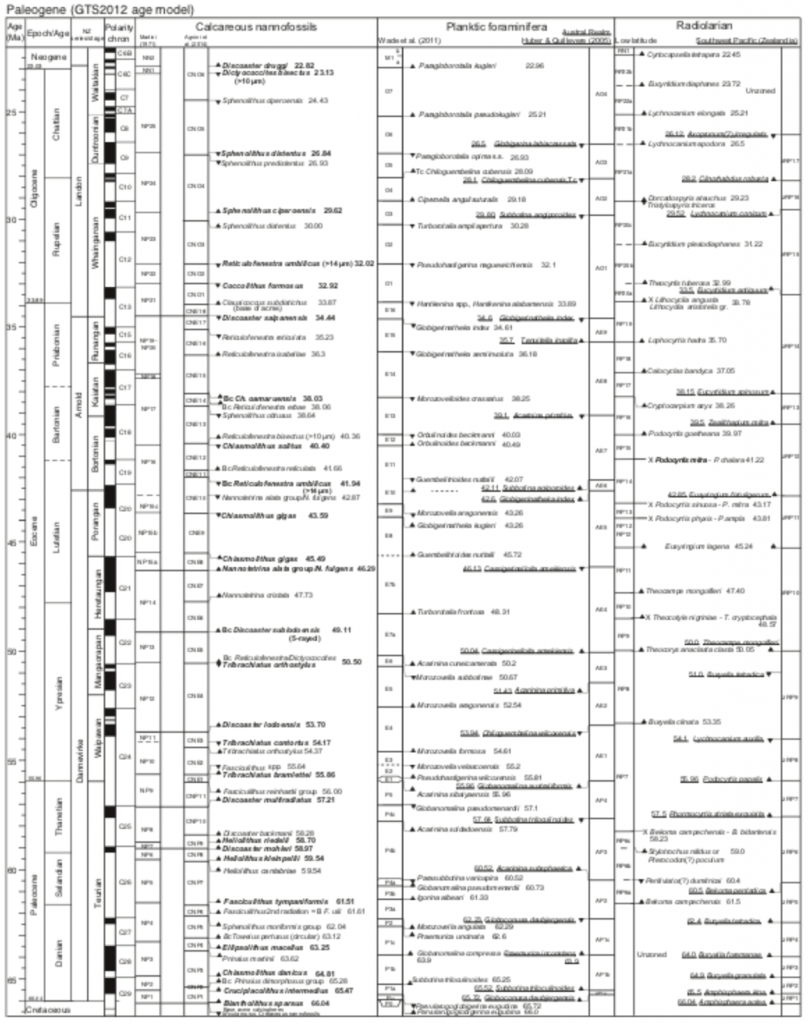
Here is a quick example of how we apply this zonation scheme in real-time drilling decisions. Consider when we are drilling down through the Eocene (the second column of this chart) and approaching the Paleocene/Eocene boundary at ~56 million years ago. Typically it is Team Nanno on the lookout because they are able to make their slides so much more quickly than the other specialists. In this case, Team Nanno is on the lookout for the extinction of the Fasciculithus group (the downward facing triangle at 55.64 million years ago) and the appearance of Tribrachiatus bramletteii (the upward facing triangle at 55.86 Ma). While Team Nanno is desperately searching for these marker species, they have the added stress of one or both co-chief scientists breathing down their necks for confirmation in order to communicate the information to the drillers. Beautifully done, Rosie and Isabella!
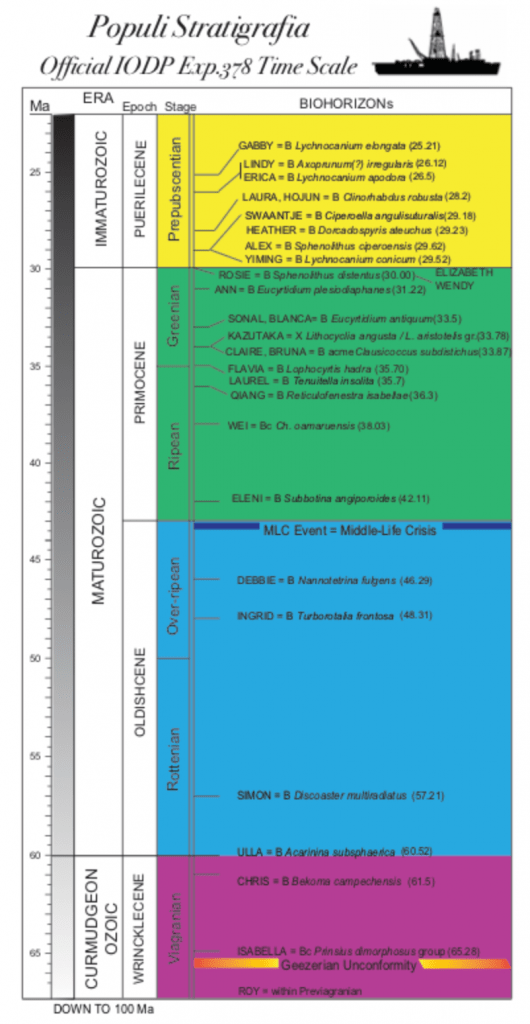
Speaking of Isabella, our dear friend has produced a zonation scheme for the shipboard science party. Our personal appearances in the geologic record (notextinctions….) definitely span quite a range….
Until the next time,
Over-ripean DT (sigh)