On Ocean Drilling and Expectations
This post was written with contributions from Expedition 397T Co-Chief Scientist Dr. Will Sager.
At this point I’ve led more than fifty live ship-to-shore broadcasts from the JOIDES Resolution, and a question that students ask time after time is “How do you know where to drill?”
This is a fun question to answer, because no matter what the audience expected, the scope of planning where to drill for any given expedition goes beyond their wildest expectations. It’s also bitingly relevant now, as core after Expedition 397T core gives us something different from what we were hoping for.
WE WANNA ROCK
Expedition 397T came to the Walvis Ridge for basalt. The Walvis Ridge is a hotspot track, which means it was formed by the eruptions of volcanoes not at the boundaries between tectonic plates, but due to upwellings of hot, buoyant mantle material. Walvis Ridge is remarkably complex, and unlike any other known hotspot track; for this reason Expedition 391 and the bonus Expedition 397T have been dedicated to understanding its mystery.
Basalt is a fine-grained, mafic igneous rock. Its small crystal size means that it forms on Earth’s crust, rather than inside it (in other words, it erupted out of a volcano), and mafic describes the composition of the rock, indicating an origin in the mantle. Seeking the rocks that came directly out of the Walvis Ridge hotspot volcanoes is crucial to achieving the scientific objectives of the expedition.
First of all, it is geochemically important that we are studying these lava flows. Given the complexity of the Walvis Ridge, we are trying to figure out what exactly is going on inside Earth that led to the formation of such an unusual ridge. Geochemical analyses of the composition of the basalt at different locations along the ridge will tell us how many distinct mantle sources were involved in the volcanism, and if there was any mixing between sources.
Rocks in the Walvis Ridge may also hold the key to demonstrating that Earth’s experienced a shift relative to its axis of rotation at the time of their formation. Known as true polar wander, this process is highly contentious among geoscientists. In order to test that true polar wander occurred, we need to analyze the magnetic field preserved in the rocks at the time of their formation, and basalt that formed in situ can be remarkably good at recording an ancient magnetic field.
MAKING WAVES
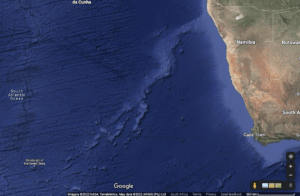
So, we know what we want. But how do we make sure to go where we can get it? The first thing to consider is bathymetry. Though a complicated word, bathymetry simply refers to the shape of the ocean floor. If you go to Google Maps and choose the satellite layer, you can see a pretty decent bathymetric map, showing submarine peaks and valleys just as, if not more, complex than Earth’s continents. When you look at the bathymetry of Walvis Ridge, you can see why scientists are so fascinated by it. To the northeast is the Valdivia Bank, a somewhat squiggly broad underwater plateau. To the southwest is the “trident” the area where the hotspot track branches into three distinct chains. We can use bathymetry to identify the Walvis Ridge volcanoes that we want to drill into.
However, bathymetry only tells us what the seafloor looks like. If we’re going to drill down, we also need to know what’s under the seafloor.
How is it possible to know what lies beneath the ocean floor without drilling into it first? Just like doctors send x-ray waves into our bodies to see where we’ve broken a bone, scientists send seismic waves to see what the ground is made of underneath the surface.
Scientists have known that earthquakes send waves through the planet since before the advent of modern religion. As technology advanced and seismometers were developed, scientists realized that seismic waves travel differently through different materials. This helped us determine that Earth’s interior is differentiated into layers, and it is the same principle that allows us to interpret unseen geology at a more local level.
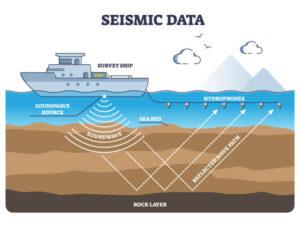
Here’s how it works: a scientist will go out into the ocean on a boat and use a machine to send low-frequency acoustic waves to the bottom of the ocean. Some of those waves will bounce back when they hit the ocean floor, but some will penetrate into the layers of sediment and rock that comprise the seafloor before being reflected back to the surface.
As the seismic waves make their way back to the ocean surface where they are recorded by another instrument, there are two ways that they can help us interpret geology: seismic velocities and seismic reflectors. Each material has its own seismic velocity – the speed at which seismic waves can travel through it. Thanks to tens of years and hundreds of experiments, we know pretty accurately what material waves are traveling through based on their speed. For example, basalt is much denser than sediment, so seismic waves travel more quickly through it.
Another way that seismic waves help us interpret geology is because of something called reflectors. Each time a seismic wave travels through a new material, the velocity changes, but an amount of the wave also is reflected by the new layer and sent back to the recording instrument.
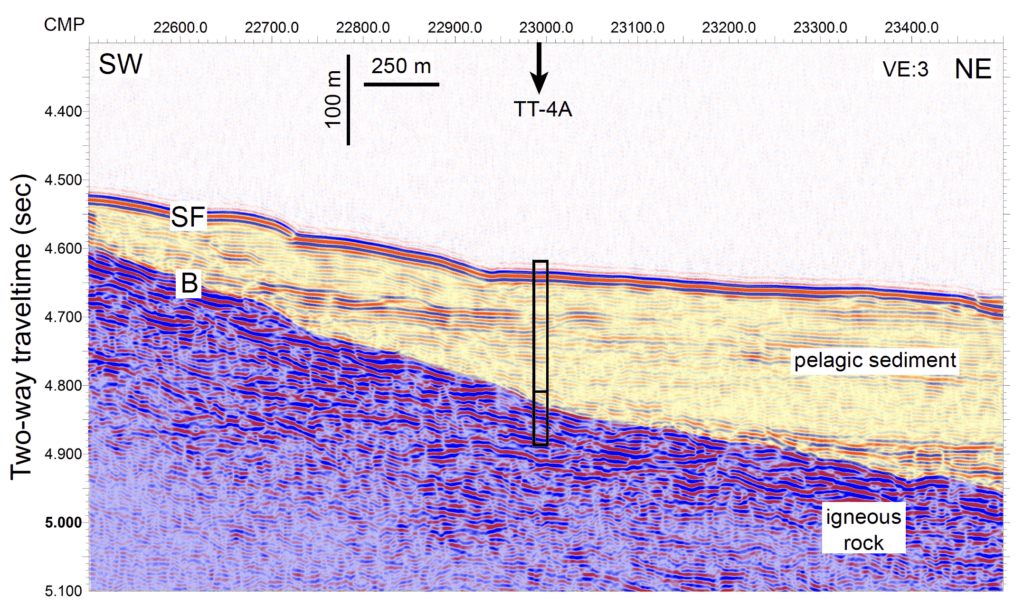
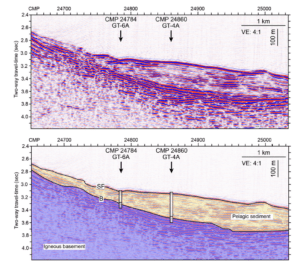
When the data are processed by a computer program, the result is an image like the one below. By interpreting the different seismic velocities measured, and the locations of different reflectors, it is possible to infer where the ocean water becomes sediment, and where the sediment transitions into igneous basement rock.
SEEING IS BELIEVING
The science sounds bulletproof, right?
Wrong. Unfortunately.
Drilling into site GT-6A was an exercise in unfulfilled expectations. Seismic profiles indicated that we should hit igneous basement rock approximately 165 m below the seafloor. We planned to “wash” down to 145 m—drill without collecting cores—so that we could recover about 20 m of sedimentary rock before we hit the basalt we were aiming for. These two cores of sedimentary rock would be useful for telling us more about the undersea environment we were working in, and would very likely contain fossils that would allow us to approximate a minimum age for the lava flow below them.
About 170 m below the seafloor, the drillers sensed a change. All of a sudden there was a drop in torque and the rate of drilling drastically decreased. This kind of change typically indicates the transition from drilling through relatively soft sedimentary rock to something much harder. In other words, every indication told us we reached basalt.
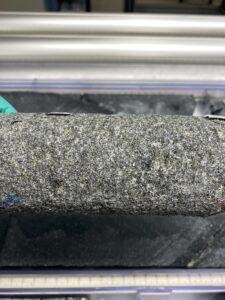
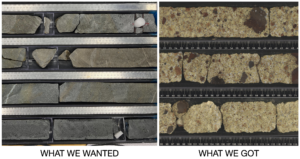
But the cores we recovered were not that. Instead of uniform dark-grey igneous rock, our split cores revealed a kaleidoscope of green, white, brown, red, and black fragments cemented together. What we thought was going to be a standard run-of-the-mill igneous rock was instead a frenetic jumble of volcaniclastics lithified into a breccia.
This was not so unusual; even in Expedition 391 we found layers like this above the basalt we sought. Rocks like these tend to form when volcanoes erupt pyroclastically in shallow water. If we kept drilling, we would soon reach what we came for.
Right?
Wrong. Unfortunately.
Core after core at our first site yielded that breccia that was so beautiful, but so irrelevant to our goals. The fragments of igneous rock preserved in the breccia were too altered to preserve the geochemical information we need, and without an orientation they could do little to offer an answer to the question of true polar wander.
So what could we do? Our coring time for this expedition is very limited, given that we need to transit all the way to Lisbon. Eventually, our co-chief and expedition project manager made the decision to leave the site and try to find basalt somewhere else.
After the success we had finding basalt during Expedition 391, we thought it would be easy a second time around. But as EPM Peter reminds us, “We just have no idea what’s down there. We know the surface of Mars better than we know the seafloor.”
And despite the disappointment that Co-Chief Will felt, he makes a pretty good point: “If we knew what we were going to find, we probably wouldn’t need to drill into it in the first place.”