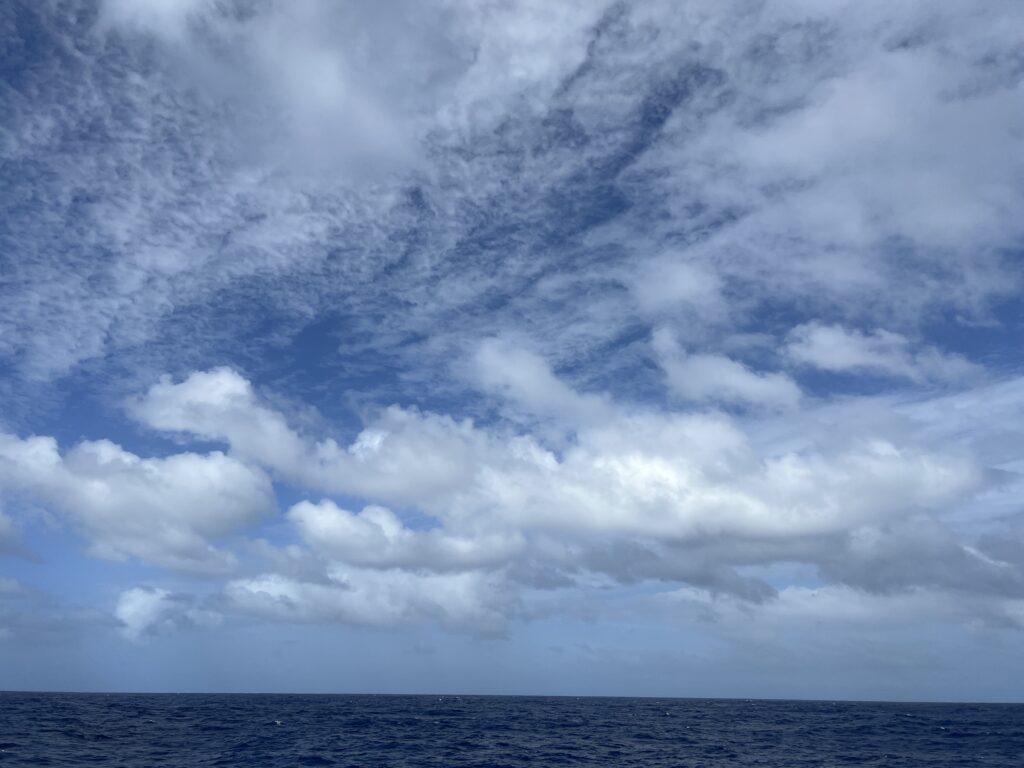
Blue skies and cloud cover on Expedition 390
To increase accessibility to our expedition, click to listen to the page text read aloud.
Before we connect with classrooms during our ship-to-shore broadcasts, we ask teachers which topics relating to scientific ocean drilling they would like us to address during our Zoom session (plate tectonics, life at sea, careers, etc.). Teachers can also suggest additional topics beyond what we typically discuss on a tour. During this expedition, we have a few classes that are covering clouds, so we thought we would provide an interesting weather data point we collect daily – the sky/cloud cover.
In our Daily Operations Report (DOR), we receive updates on the weather as recorded during the previous day. These data points include wind speed and direction, air and sea water temperature, barometric pressure, visibility, and sky/cloud cover. We have another blog post that shares some of the data we collected during transit, such as waves, swell, heave, and ship speed and distance traveled (see Our Transit to the First Drill Site, as Told Through Data).

Cloud cover, sometimes called cloud amount, is the fraction of the sky covered by cloud of any type or height above the ground. It is measured on a scale that starts at zero for a clear sky, and extends to 8 for a sky that is completely overcast. A value of 1 means that 1/8 of the sky is covered in clouds. A value of 2 means that 2/8 (or 1/4) of the sky is covered in clouds, and so on. The units used to report sky covered is the okta. On JOIDES Resolution, 2nd mate Dean Southhall makes the daily visual observation and records the okta value for cloud cover, which is included in the DOR. Other meteorological data for our archives and forecast are provided by NOAA NCEI Global Forecast System and Fleet Numerical Meteorology and Oceanography Center (FNMOC).
On this page we share the sky/cloud data collected for our dates from transit from Cape Town, South Africa, to our first drilling site. We encourage teachers to visit our other blog post on the transit data for ideas for how students can work with the data and sample questions to which students can respond.
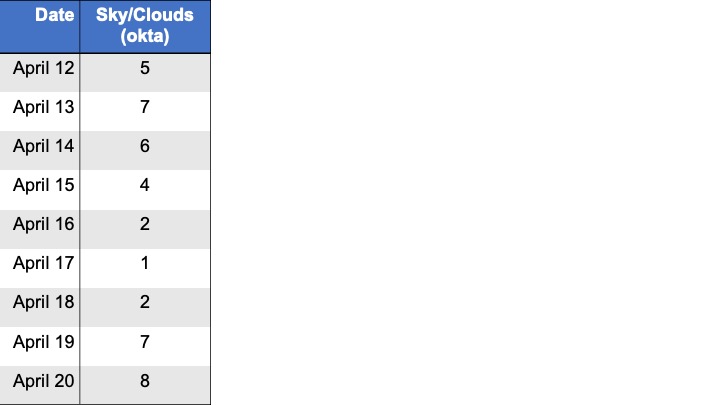
Here you can access the full cloud cover data for the expedition in the spreadsheet.
*Click on this link to open the entire file in Google Sheets (viewer mode only)
For further information about clouds, visit:
- Types of clouds (NOAA SciJinks, text and video)
- NWS Clouds (Introduction) and NWS Cloud Chart (National Weather Service)
- NOAA Cloudwise/Weatherwise Poster (National Weather Service)
- Types of Clouds and Articles (NOAA National Environmental Satellite Data and Information Service)
- How we measure cloud (Met Office)
For additional quantitative exercises working with data from Expedition 390, please visit our other blog posts:
- Expedition 390 fuel, distance, time, and speed, as told through data
- Expedition 390 wind and ship’s heading, as told through data
- Expedition 390 ship motion (heave), as told through data
- Our Transit to the First Drill Site, As Told Through Data (*includes daily data for time of travel, distance, speed, wind, waves, swell, heave, during our initial nine-day transit)