Our transit to the first drill site, as told through data
To increase accessibility to our expedition, click to listen to the page text read aloud.
We are excited to have so many ship-to-shore broadcasts scheduled for Expedition 390. In addition to providing teachers Educator Resources for EXP 390 for our two months at sea, we are providing some data that we collected during our transit time to our first collection site (Hole U1556B). We suggest some questions you can use as a starting point to engage your students with the data. There are plenty of additional ways students can build their quantitative skills from our expedition, such as generating graphs for comparison or seeing if they can make any observations on their own.
We have broken up the data into smaller, separate tables on this page.
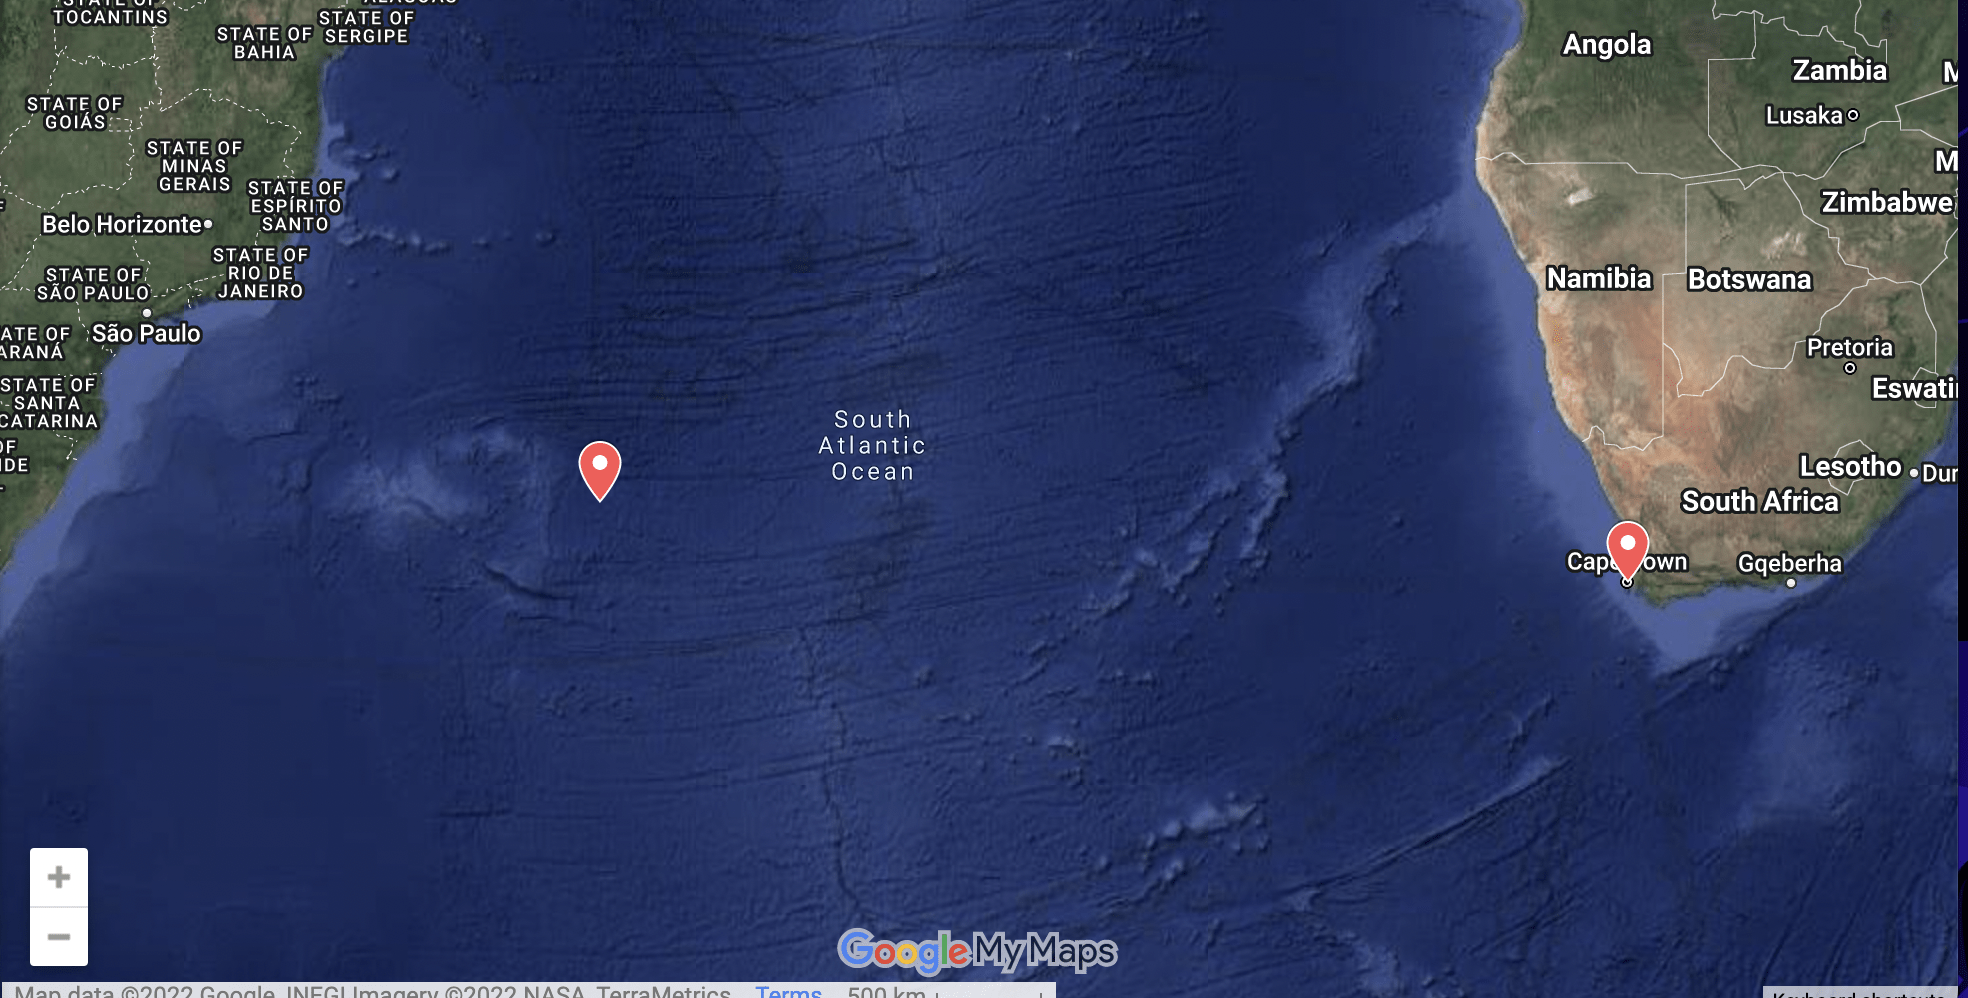
Location of JOIDES Resolution
Students can use this data to plot our starting and ending points for the first part of our expedition in Google Maps or Google Earth. Teachers can also bring up the daily JR location map we have been maintaining in Google Earth throughout the expedition, which contains a photo and short summary of an activity from that date. For curious students, NOAA Ocean Facts has a summary of What is latitude? and What is longitude?
Position of JOIDES Resolution at our point of departure (Cape Town, South Africa), April 12, 2022
Latitude: 33° 54.978′ S, Longitude: 018° 26.356′ E
Position of JOIDES Resolution at our first collection site (South Atlantic Ocean), April 20, 2022
Latitude: 30° 56.5244’ S, Longitude: 26° 41.9472’ W
Terminology
First, let’s expand upon the units we use to take measurements at sea and some nautical terms.
- Nautical mile – Nautical miles are used to measure the distance traveled through the water. A nautical mile is slightly longer than a mile on land, equaling 1.1508 land-measured (or statute) miles. Because travel at sea typically covers a much longer distance than on land, the curvature of the Earth becomes a factor in getting an accurate measurement. In fact, one nautical mile equals one minute of latitude. (see NOAA Ocean Facts)
- Knot – A knot is one nautical mile per hour. (see NOAA Currents Tutorial)
Note that a nautical mile measures distance, and a knot measures speed.
- Wave – Waves are energy passing through water, causing the water to move in a circular motion. The water in waves doesn’t travel much at all, even though it appears as if the water is moving forward. The only thing waves do transmit across the sea is energy. (see NOAA Exploration Facts and NOAA Currents Tutorial)
- Swell – A regular movement of waves vertically (up and down) in the ocean. A swell is defined as having moved well beyond where it was generated, possibly as far as thousands of miles! (see NWS Wind, Swell and Rogue Waves)
- Heave – The up and down motion of a ship due to wave action. (see Nautilus Live Beyond the Wow: The Six Types of Ship Motion)
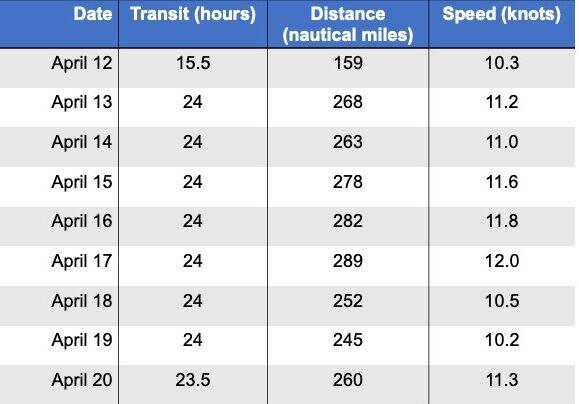
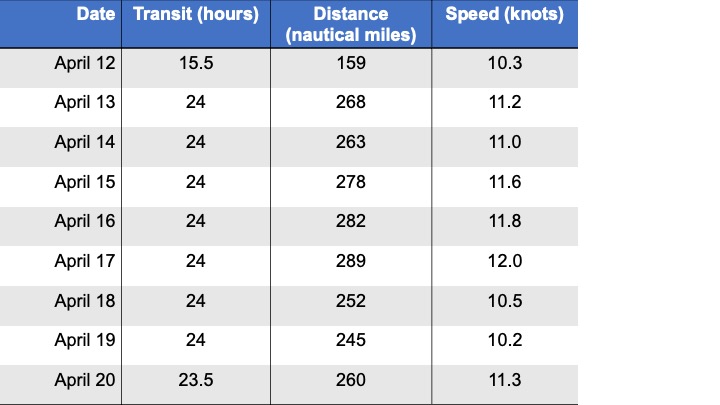
Data for transit to Hole U1556B
We present in tables some of the information collected during our transit from our departure port to our first site for collecting samples. We hope these data will encourage your students to look for connections and think about what additional data we could have collected/provided (such as daily air temperature, sea water temperature, cloudiness, how much fuel was used by the ship, etc.). These data can also be used for a graphing exercise before students respond to the questions.
Questions
- Where are our starting and ending locations on a map?
- How many days did it take us to get from Cape Town to our first site?
- What was our total transit time from Cape Town to our first site?
- What was the total distance we traveled? Which day did we travel the most distance? The least?
- Which day did we move the fastest? The slowest? What was our average speed over the transit?
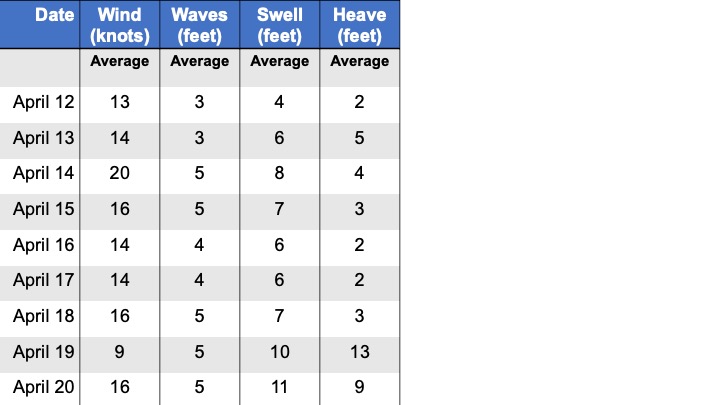
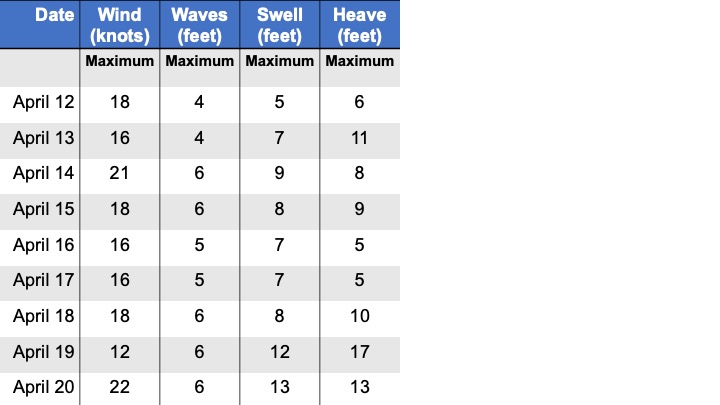
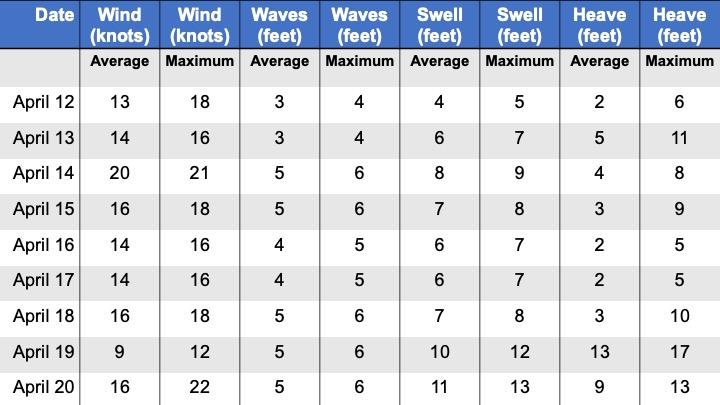
The following three tables have the measurements broken down by the average daily value, the maximum daily value, then combined in the same table.
- Which day had the highest average wind speed? Was it the same day that had the highest maximum wind speed? Why might these days be the same date or different dates?
- Did we have the highest waves on the days with the highest wind speeds? What is the connection between wind and waves?
- Does the ship always have a large heave on the days of a large swell? Why might these be connected to each other, or not?
- (*and many more questions can be asked with this data! Enjoy!)
For additional quantitative exercises working with data from Expedition 390, please visit our other blog posts:
- Expedition 390 fuel, distance, time, and speed, as told through data
- Expedition 390 wind and ship’s heading, as told through data
- Expedition 390 ship motion (heave), as told through data
- Blue Skies and Cloud Cover on Expedition 390 (*cloud cover data for the full expedition)